Introduction
SamPlexer is a software system for planning and managing sample multiplexing for Next-Generation Sequencing. The system at the moment has 5 main functionalities:
- Assessing multiplexing strategy species to be multiplexed (i.e. pooled/mixed) and sequenced together (this step is done by Crossmapper pipeline)
- Demultiplexing of NGS data generated by sequencing of pooled samples
- Job tracking system
- Management of reference genomes
- Databases of the jobs and obtained results
Accessing SamPlexer
At the Barcelona Supercomputing Centre (BSC)
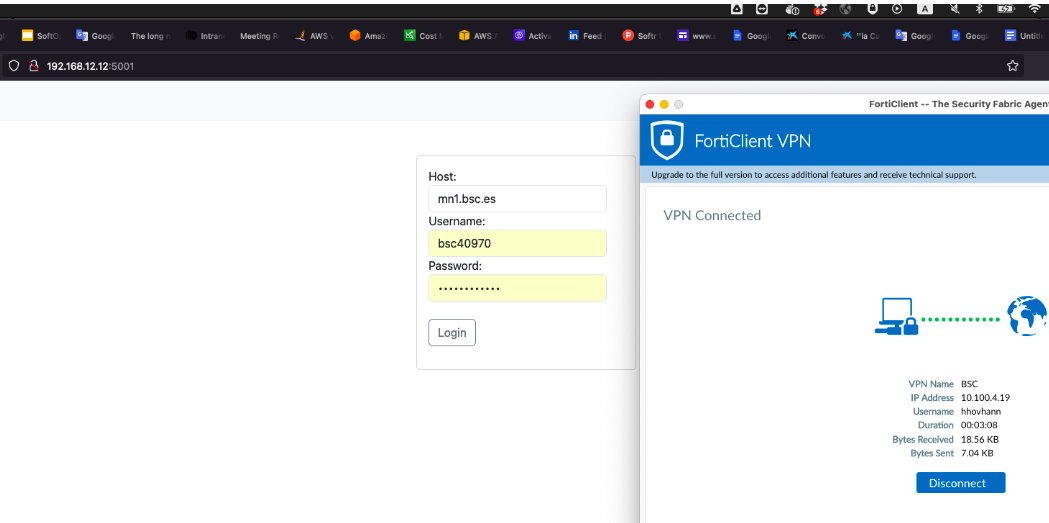
To access the SamPlexer system:
- If you are not at the BSC, connect to the BSC VPN. If you are at the BSC you don't need to use VPN.
- Enter the system using the link http://192.168.12.12:5011/ and login with your BSC credentials.
For example:
- Host: glogin1.bsc.es
- Username: bsc040970
- Password: <your_MN_password>
At Centre for Research of Biomedicine (IRB)
To access the SamPlexer system:
- If you are not at the IRB, Connect to PCB VPN. If you are at the IRB you don't need to use VPN.
- Enter the system using the link http://84.88.74.151:5011/. If you are not registered yet, create your User and Password, and then login to the system.
- (Optional/Will change) Make sure you have access have the output folders of SamPlexer by mounting the virtual machine of SamPlexer to your local computer (if you have a stable internet connection, this needs to be done only once).
If you are on Linux or Mac:
Type in your terminal:
* this user is not the same as the user created at the login page of SamPlexer, it is created for you by the SamPlexer team
Type the password for <your_user>. After this you should be able to find the output directories of SamPlexer in your /local/path/to/mount folder.
If you are on Windows:
...
Once you are able to login to SamPlexer, you can run the necessary jobs.
As mentioned earlier, SamPlexer has several functionalities corresponding to its different tabs located at the top of the page: Crossmapper (multiplexing strategy assessment), Demultiplexing, Management of the reference genomes, job tracking system and output databases for both Crossmapper and Demultiplexing (which are found in corresponding tables)
Running Crossmapper
Let's start using the system with Crossmapper to assess the multiplexing strategy of certain organisms.
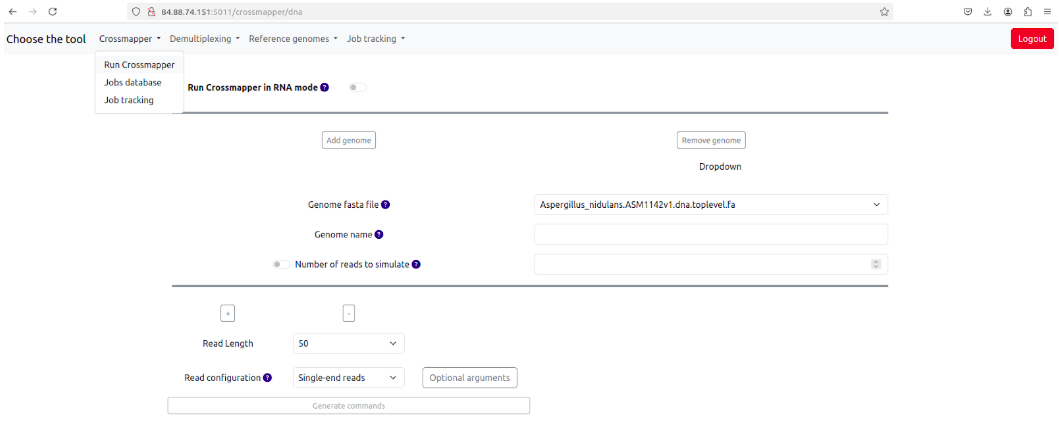
Fig. 2: Selecting and running Crossmapper
Crossmapper is an automated bioinformatics pipeline for assessing the rate of read crossmapping when two or more organisms are sequenced as one sample. Based on in-silico read simulation and back-mapping to the original genomes of sequenced organisms, Crossmapper allows the users to assess the rate of incorrect unique and multimapped reads to non-corresponding genomes and thus helps to optimize the sequencing parameters such as the read length, paired/single-end, mapping parameters, etc., prior to performing the actual sequencing experiment. See our paper for more details.
Configuring Crossmapper
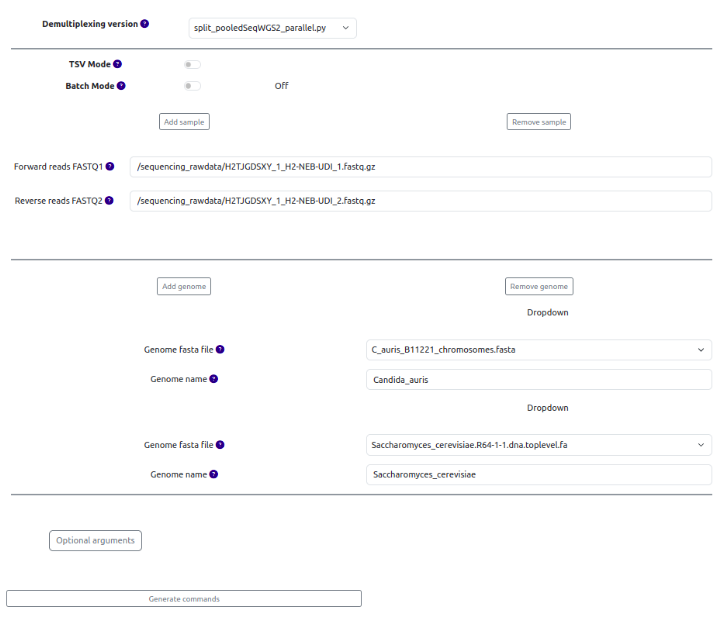
To run Crossmapper, you need to select reference genomes, give them some names and select the number of reads or coverage to simulate from each genome.
Crossmapper has 2 modes: DNA and RNA. By default it uses DNA mode which uses entire reference genomes to run the analysis, while RNA mode is used by additionally supplying a gff/gtf file which is used to extract the features of interests (genes, exons, etc) and run Crossmapper only based on the sequences of those features.
- You can click the "Add form" sign to add genomes.
- Genomes are chosen from the dropdown menu. If you need to add more genomes, please see the "Reference Genome database and addition of new reference genomes" sections.
- Then you need to choose the read lengths you want to simulate, for example 50, 100, 150 (use the + sign to add them), and select read configuration - single-end (SE), paired-end (PE) or both.
- You can also choose multiple Optional arguments by clicking the corresponding button.
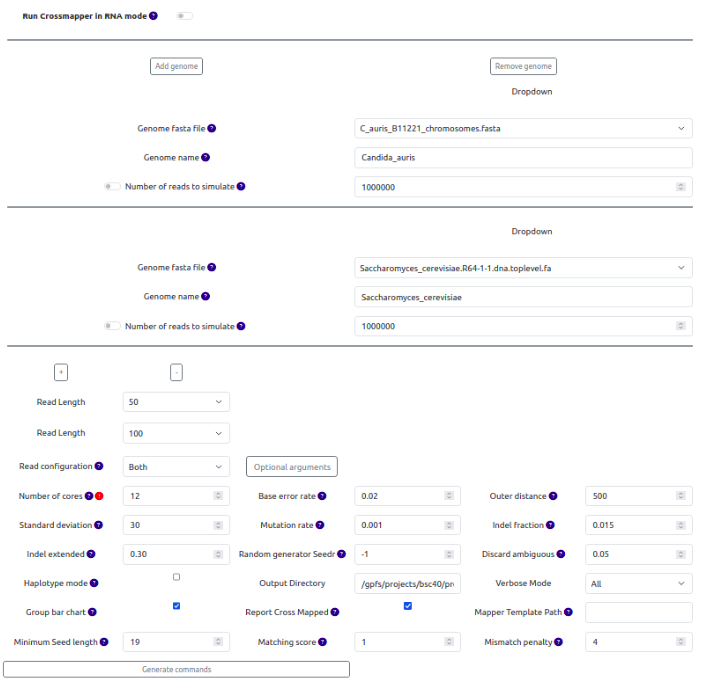
Fig. 3: Generating Crossmapper commands
Hover over the ? sign of each parameter to see its description.
If there are any errors or missing fields, SamPlexer will display them at the bottom of the page. When everything is correctly selected, click Generate commands.
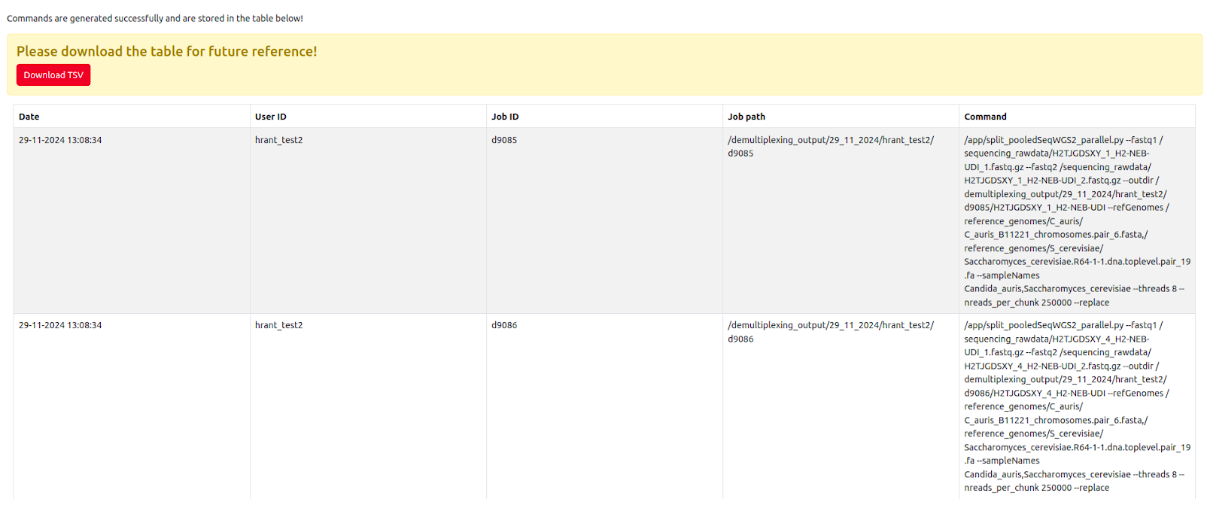
At this point it will display a table with different information, including the user ID, generated job id, data, time, and the generated command, also allowing to download that table (which is recommended) for future reference.
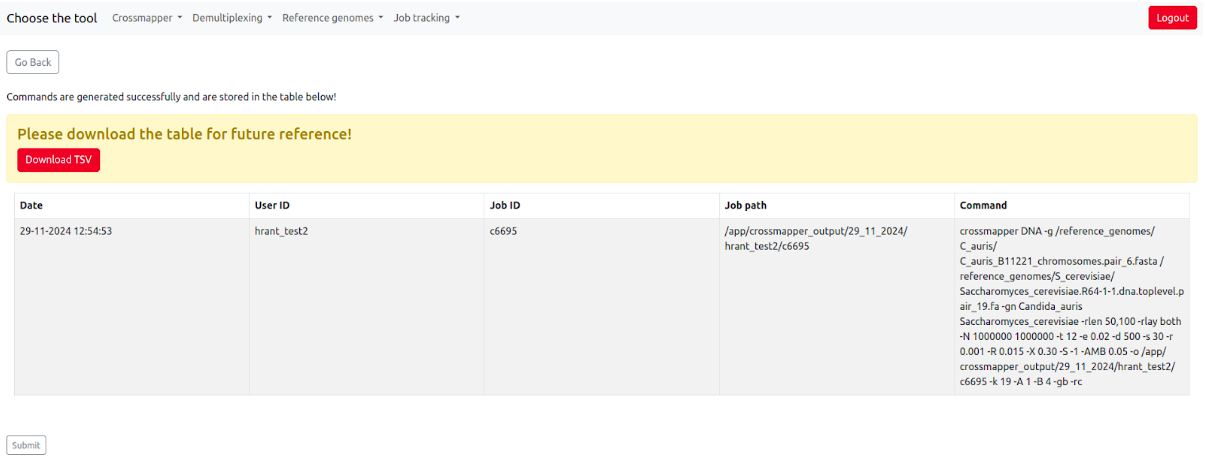
On this page, users can double-check if their job is correct, and then click the "Submit" button at the bottom of the page. After submitting the commands, SamPlexer will confirm whether the job has been submitted correctly, and will show the user the link to pass to a Job tracking system to monitor the status of the job (See more details in "Job tracking system" section).
Once the job is successfully finished, the results of Crossmapper jobs will be automatically added to the Jobs database.

The Crossmapper's job database contains user id, job id, date, the exact command, the species names, the paths to genome files, the html report from Crossmapper, and the cross-mapping rates reported by crossmapper.
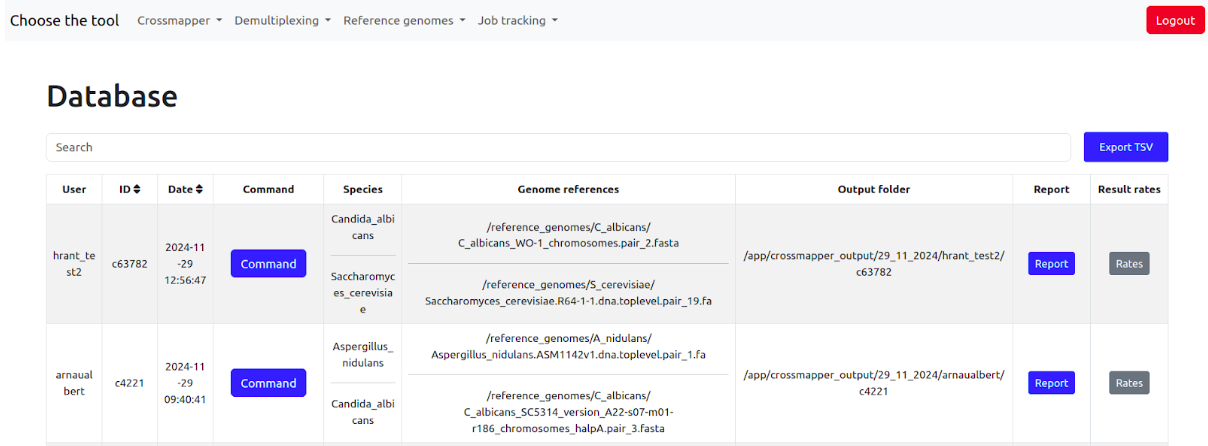
The latter two can be opened in the browser just by clicking on them.
Interpreting the Crossmapper reports
In essence, Crossmapper simulates NGS reads from each of the supplied genomes, maps those reads back to all the genomes, and then calculates the proportion of reads (i.e. mapping rates) that incorrectly map to wrong genomes. Crossmapper generates an html report that contains several highly interactive and intuitive plots and tables allowing the user to inspect different read mapping rates. If more than one read length has been specified for the Crossmapper job, the first graph is a line plot that shows the total number cross-mapped reads per read length. This plot shows mapping statistics for the following mapping categories: For each single- and paired-end reads it shows
- uniquely crossmapped reads - reads originated on one genome but uniquely mapped to other genomes;
- multi-crossmapped reads - reads originated on one genome but multimapped on the source and other genomes;
- total crossmapped reads - sum of two previous.
Hovering the mouse over the line plot will show the details for each crossmapping category. Additionally, by clicking on the legend of the plot on the left, the user can hide/show the categories.
The second graph is a bar plot showing the distribution of total cross-mapped reads per species, i.e. to which genomes reads of a given species are mapped. As with the previous plot, this graph is interactive - users can click on read lengths to show/hide specific configurations, or can click on the specific barplot which will show the distribution of crossmapped reads across species for that particular read length.
By default both graphs show read counts, but users can change them to percentages of total reads simply by clicking the switch on the top-right corner of the report. Moreover, users can download both graphs in different formats, including png, jpeg, pdf, etc or in the form of tables.
The plots are followed by tables with detailed mapping statistics for each read length and layout. There are three tables for each configuration.
- The first table shows the overall mapping statistics, i.e. number of reads, uniquely mapped reads, unmapped reads, etc.
- The second table summarizes mapping rates for each species. This table has information about different categories of reads. Two main categories are Correctly and Incorrectly mapped reads.
- The final third table represents a detailed breakdown of three categories of crossmapped reads (unique, multi and total) per species, and in fact represents a data matrix. By hovering the mouse over the rate of interest, the user can additionally see the percentage of total mapped reads of the species that particular rate represents.
Correctly mapped reads refer to the reads that originate and map on the same genome regardless of their mapping position, e.g. even if the read has originated on chromosome 1 but mapped to chromosome 2 of the same species, it is counted as correctly mapped. Correctly mapped reads are subdivided into uniquely mapped and multimapped.
Incorrectly mapped reads are those that originate on one species, but map to another, either in a unique or multimapped manner. In other words, incorrectly mapped read has at least one alignment in a different species. Hence, the category of Incorrectly mapped reads is subdivided into uniquely crossmapped and multi-crossmapped reads, and the latter is further subdivided into multimapped only to other species and multimapped to the source and other species.
Noteworthy, that by pointing the mouse on each category, the user can see its description.
As in the case of graphs, these tables also can be switched to show either percentages or raw read count.
Running Sample Demultiplexing
When the mixed sample is sequenced, the initial samples have to be separated from each other. To do this, the mixed sample needs to run through the demultiplexing process.
Let's demultiplex some samples. Go to Demultiplexing > Run Demultiplexing.
(OPTIONAL) There are different bioinformatics scripts to perform the demultiplexing as depicted at the top of the page, but we recommend using the default option.
First, we need to choose the samples we want to demultiplex. There are three options.
Option 1: Choose each sample manually
You can search for each sample by typing its name in the search bar, and available samples will appear on the fly. Once you choose the forward file, the reverse will be autocompleted automatically once you click on the search bar. To add more samples, click "Add form".
Option 2: Use the TSV mode
With this option, users can upload the data for demultiplexing using a tab-separated file specifying the absolute paths of the fastq files, the reference genomes files and the name of reference genomes for each sample. To use this option, click the toggle "TSV mode", where you also can find an example TSV file.
Option 3: Use the batch mode
Batch mode option allows users to automatically select all fastq samples located in one single folder. To use this mode, click on the Batch Mode toggle at the top and select the folder where your fastq files are located. This could be done either by dropdown menu or typing the name in the search bar. These options can be changed by a toggle.
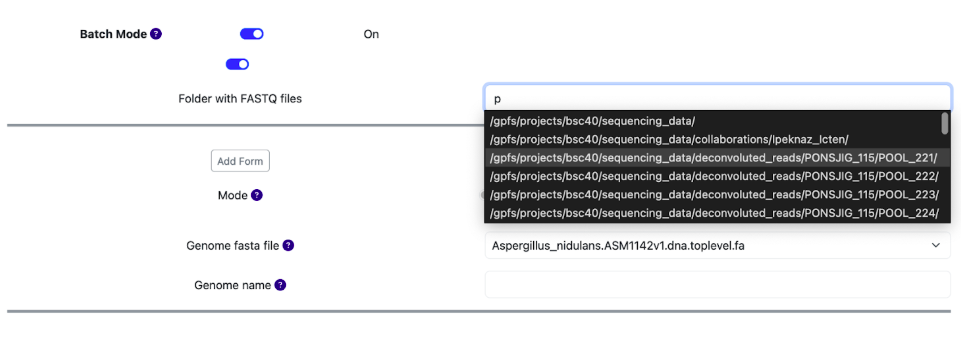
Fig. 8: Using batch mode to select samples.
In the next step, upon generating the commands for demultiplexing, the system will automatically detect the fastq files and pair them. Note, that all samples that are selected by the batch mode must contain the same multiplexed species!
After selecting the samples, the user now needs to select the reference genomes from the dropdown menu which will be used for demultiplexing.
Finally, you can select some optional arguments by clicking the corresponding button.
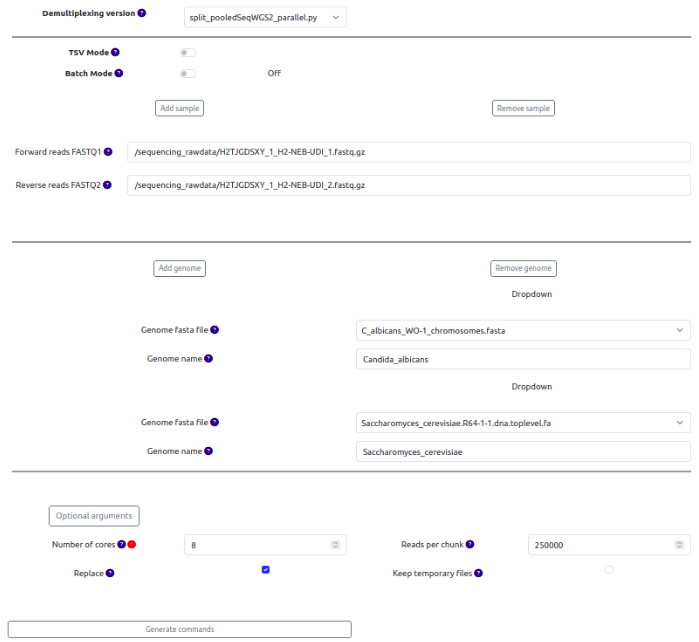
Fig. 9: Generating demultiplexing commands.
Then, similarly to the Crossmapper, hit the Generate commands button, which will display the date, user ID, job id, the destination folder, and the commands for demultiplexing. Note that batch mode accurately selected the fastq files and ignored all other files located in the initial folder. If your SamPlexer configuration runs on Slurm, before submitting the commands, you can change the job submission parameters.
After inspecting the commands click submit, which will automatically launch the generated commands.
After submitting the commands, SamPlexer will confirm whether the jobs have been submitted correctly, and will show the link to enter the Job tracking system to monitor the status of the job (See more details "Job tracking system" section).
Once the jobs are finished, the system will add all the results to the demultiplexing database automatically. To find the results, go Demultiplexing > Jobs database
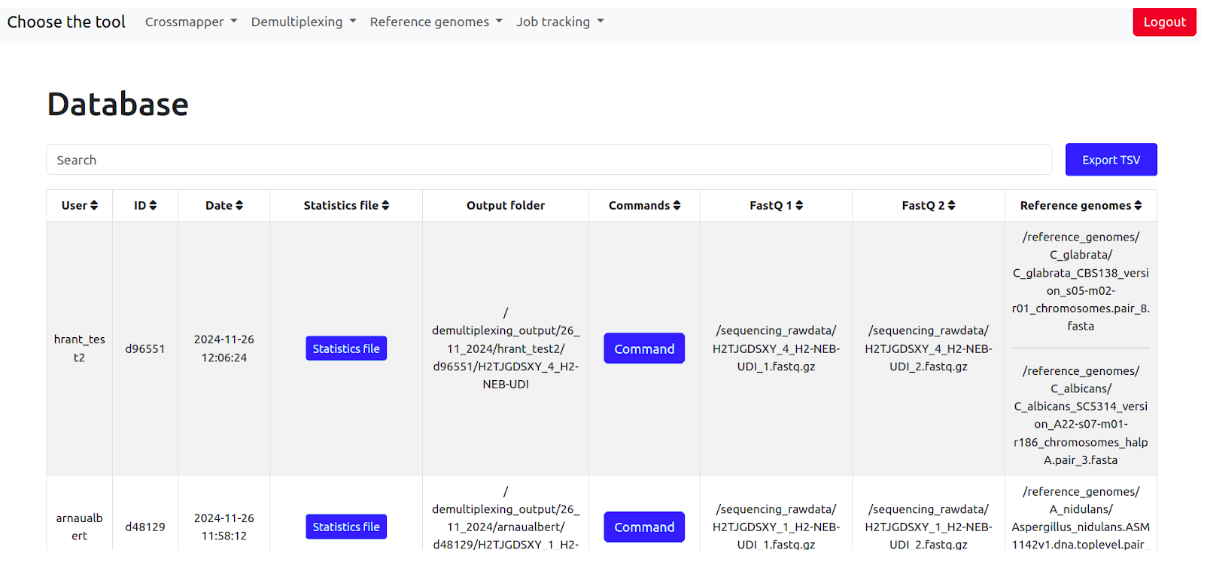
The database contains jobs id, date, read splitting statistics (can be opened in browser by clicking), output folder where all output files are stored, full demultiplexing commands, fastq1, fastq2 files, and the reference genomes.
Interpreting sample demultiplexing results
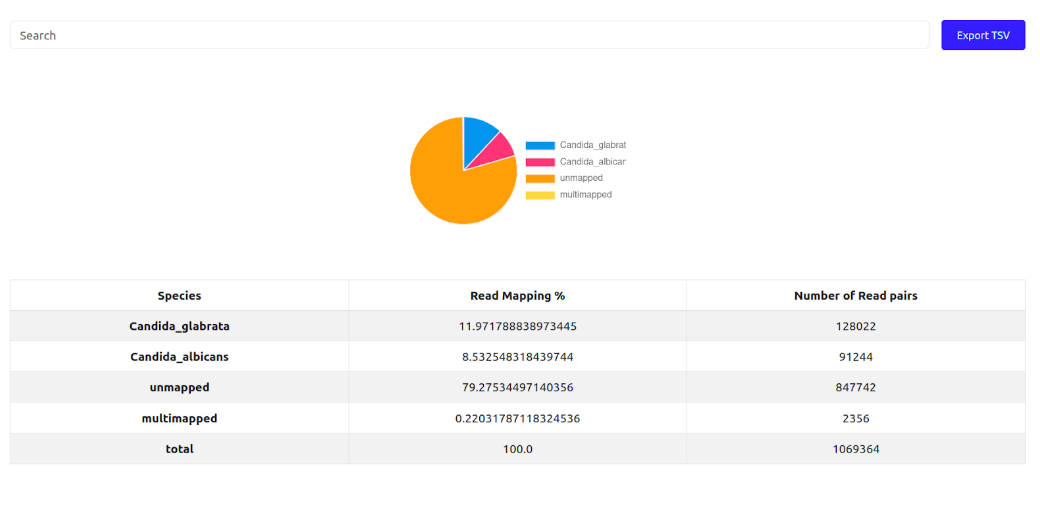
To investigate the end results of a demultiplexing run, Click the "Statistics file" of any demultiplexing job in the database. It will open a new page showing a pie chart and corresponding numbers in a table. The numbers represent the percentages of NGS reads mapped to each of the initial organism's reference genomes, along with the % of unmapped and multi-mapped reads. The last column shows the absolute number of reads in each of that category. Ideally, the number of unmapped and multi-mapped reads should be low, the proportions between the species should correspond to the proportions of DNA mixed for each species. For example, if two species of a similar genome size mixed in 1:1 proportion, the mapped reads percentage should ideally be 50%-50%.
Job tracking system
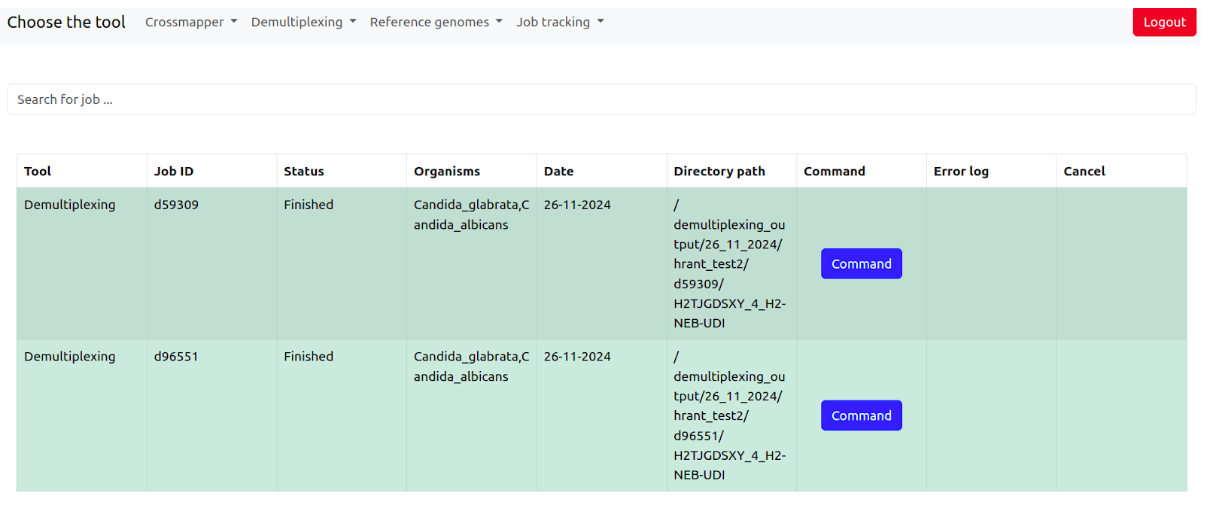
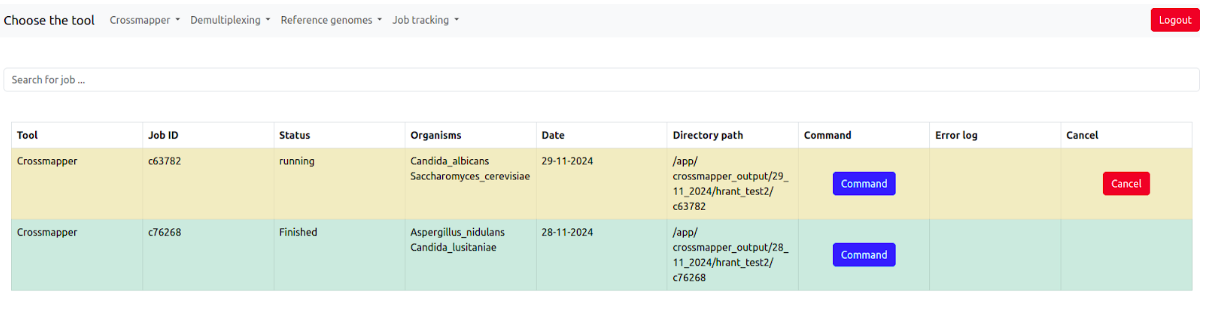
The job tracking system allows the users to monitor the status of all submitted jobs.
It contains the information about the tool, job id, job status (pending, running, finished, failed) of the job, Organisms, Date, Output directory, Command, Error log if the job has failed, and the possibility to cancel the job when it is running.
Reference Genome database and addition of new reference genomes
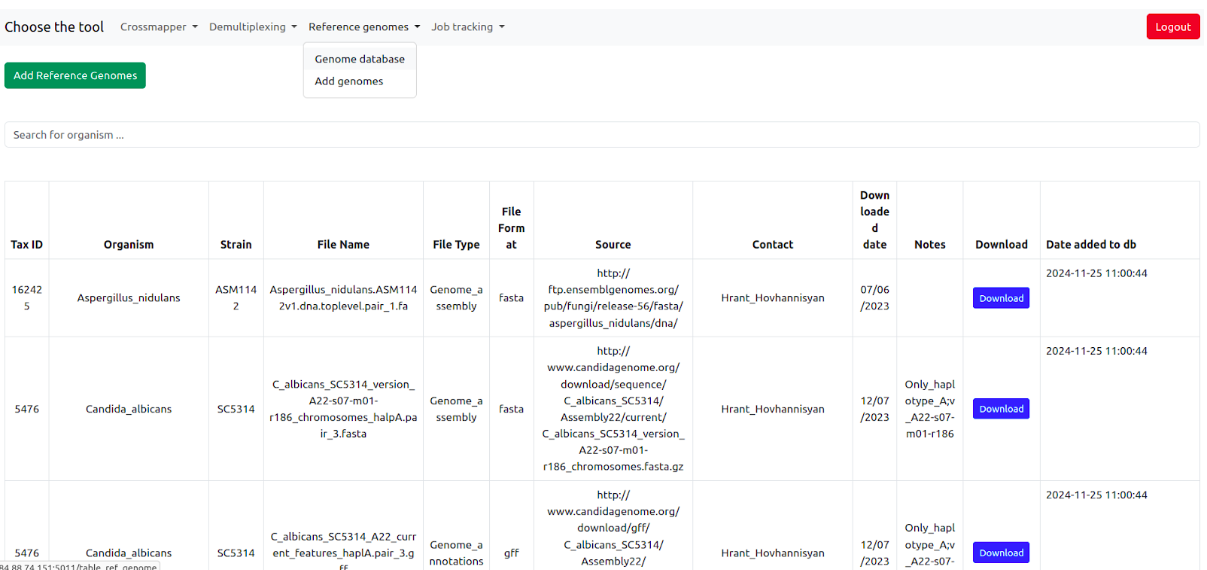
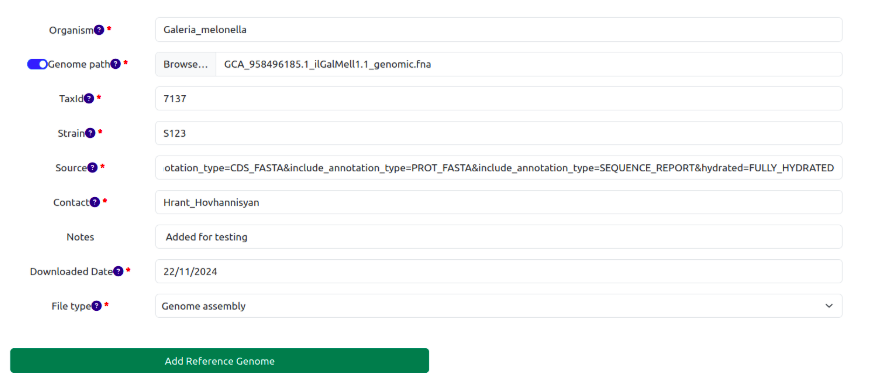
SamPlexer comes with built-in reference genomes of a few organisms, which can be explored using the reference genome database. It can be accessed by going to Reference genomes > Genome Database. However, users can upload their own reference genome to use with SamPlexer. To do this, go to the "Add reference genome" tab. Fill in all the necessary information about the reference genome, select the reference genome/annotation files (or specify the path of the reference genome in the server), and after clicking the "Add Reference Genome" button, it will be added to the database. After this, users will be able to select the added genomes from the dropdown menus of each tool.
All user-uploaded reference genomes/annotations will be stored at /reference_genomes-uploaded_reference_genomes/ in the corresponding sub-folders containing the genome files and the supplied metadata (README.txt)
If you need help, have questions, feedback or want to report a bug, please contact Hrant (grant.hovhannisyan@gmail.com) and/or Arnau (arnaualbert2003@gmail.com)